Unveiling Performance Bottlenecks With Flamegraphs Using Async-Profiler
Welcome to the first article of ‘The Month of Profiling,’ a series I will be presenting throughout November. We’ll explore a range of technologies that are crucial for identifying and resolving performance issues, as well as for fine-tuning your systems. The series will conclude with a detailed walkthrough on how to integrate these technologies for effective performance optimization.
Introduction
Optimizing the performance of a complex application like a database requires a deep understanding of multiple components; its resource utilization, the behavior of the JVM, and how nodes interact with each other. There are several useful approaches to understanding an application’s behavior, either when performance tuning or dealing with an outage. In most circumstances, teams will rely on a set of dashboards based on various metrics emitted from the database and the underlying operating system. However, the picture is only as complete as the metrics that are available, and in my experience, there can never be enough metrics get a complete understanding of an application’s behavior. In an ideal world, we’d know exactly where our time is spent and what is allocating memory, two things that have an enormous impact on performance. By understanding what’s happening in our database and the tuning that are available, we can often tweak some settings for a significant improvement in performance.
Introducing Async-Profiler
To achieve the most complete understanding of a database, I regularly turn to visualizing profiler data with flame graphs. One such tool that can help you is the async-profiler, an open source sampling profiler for Java. In this post, we will explore the use of async-profiler to profile Apache Cassandra, focusing on CPU profiling and heap profiling. By the end of this post, you will have a clear understanding of how to leverage async-profiler to uncover a wide range of performance issues with your Cassandra deployment. One of the main benefits of using a sampling profiler is the ability to run it on production systems without introducing a significant impact. Sampling profilers don’t look at every line of code executed - they essentially operate on a timer, sampling the state of the application. Sampling profilers aren’t perfect, and they can’t catch every problem. However, for ongoing, consistent issues where you’re looking to improve overall performance, they’re incredibly revealing.
Getting Started with Async-Profiler
Before we dive into the specifics of profiling Apache Cassandra, let’s cover the basics of using the async-profiler. First, you’ll need to download and extract the latest release from the Downloads section of the project. Make sure you grab the correct one for your environment. In my case I’m running in Ubuntu on Intel, so I’ve downloaded the linux x86 archive.
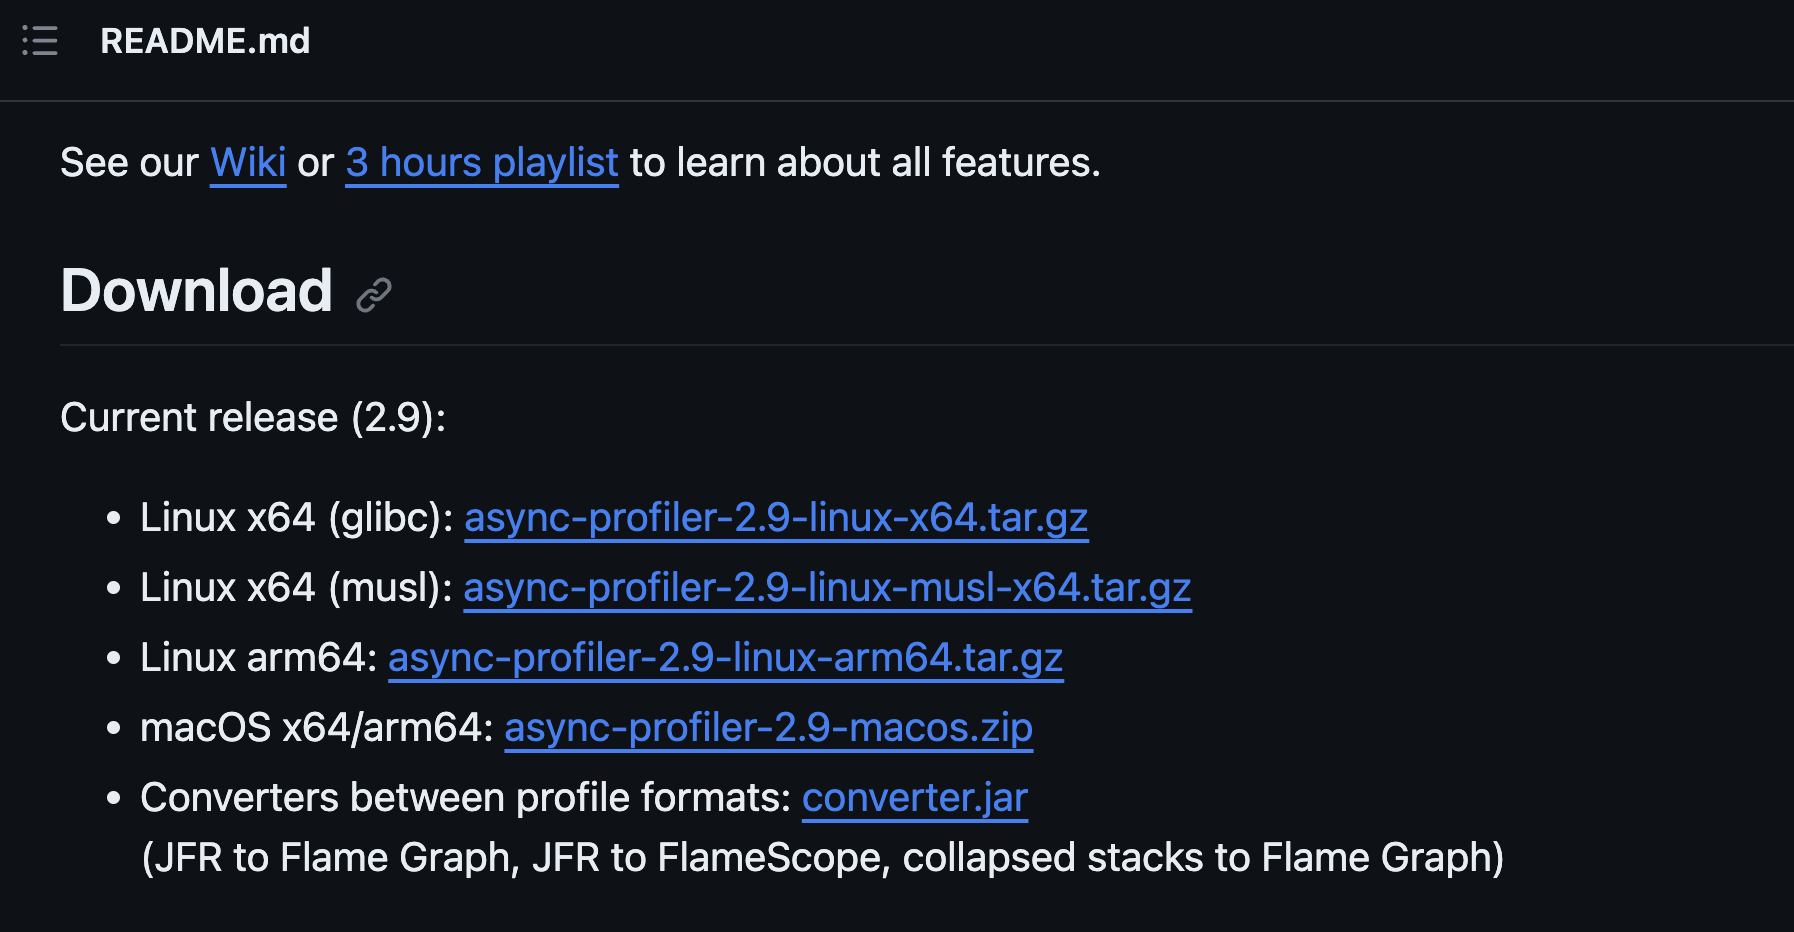
Extract the archive (your file may be different):
tar zxvf async-profiler-2.9-linux-x64.tar.gz
Now we can take a look at some basic usage.
CPU Profiling
CPU profiling is a critical aspect of identifying areas in your code that consume an excessive amount of CPU time. In a lot of cases, spotting a performance issue is as simple as looking at the widest area of the flame graph.
To perform CPU profiling on Apache Cassandra, you’ll first need to set some kernel settings:
sysctl kernel.kptr_restrict=0
sysctl kernel.perf_event_paranoid=1
Now you can run the profiler. The -d flag is for duration, in seconds. -e is the event you want to profile (cpu by default), and -f tells async-profiler where to put the output. Using a html extension automatically renders a flame graph. Lastly, we pass our process ID, I stored mine in a environment variable called PID:
./profiler.sh -e cpu -d 30 -f /tmp/cpu-cassandra-flamegraph.html $PID
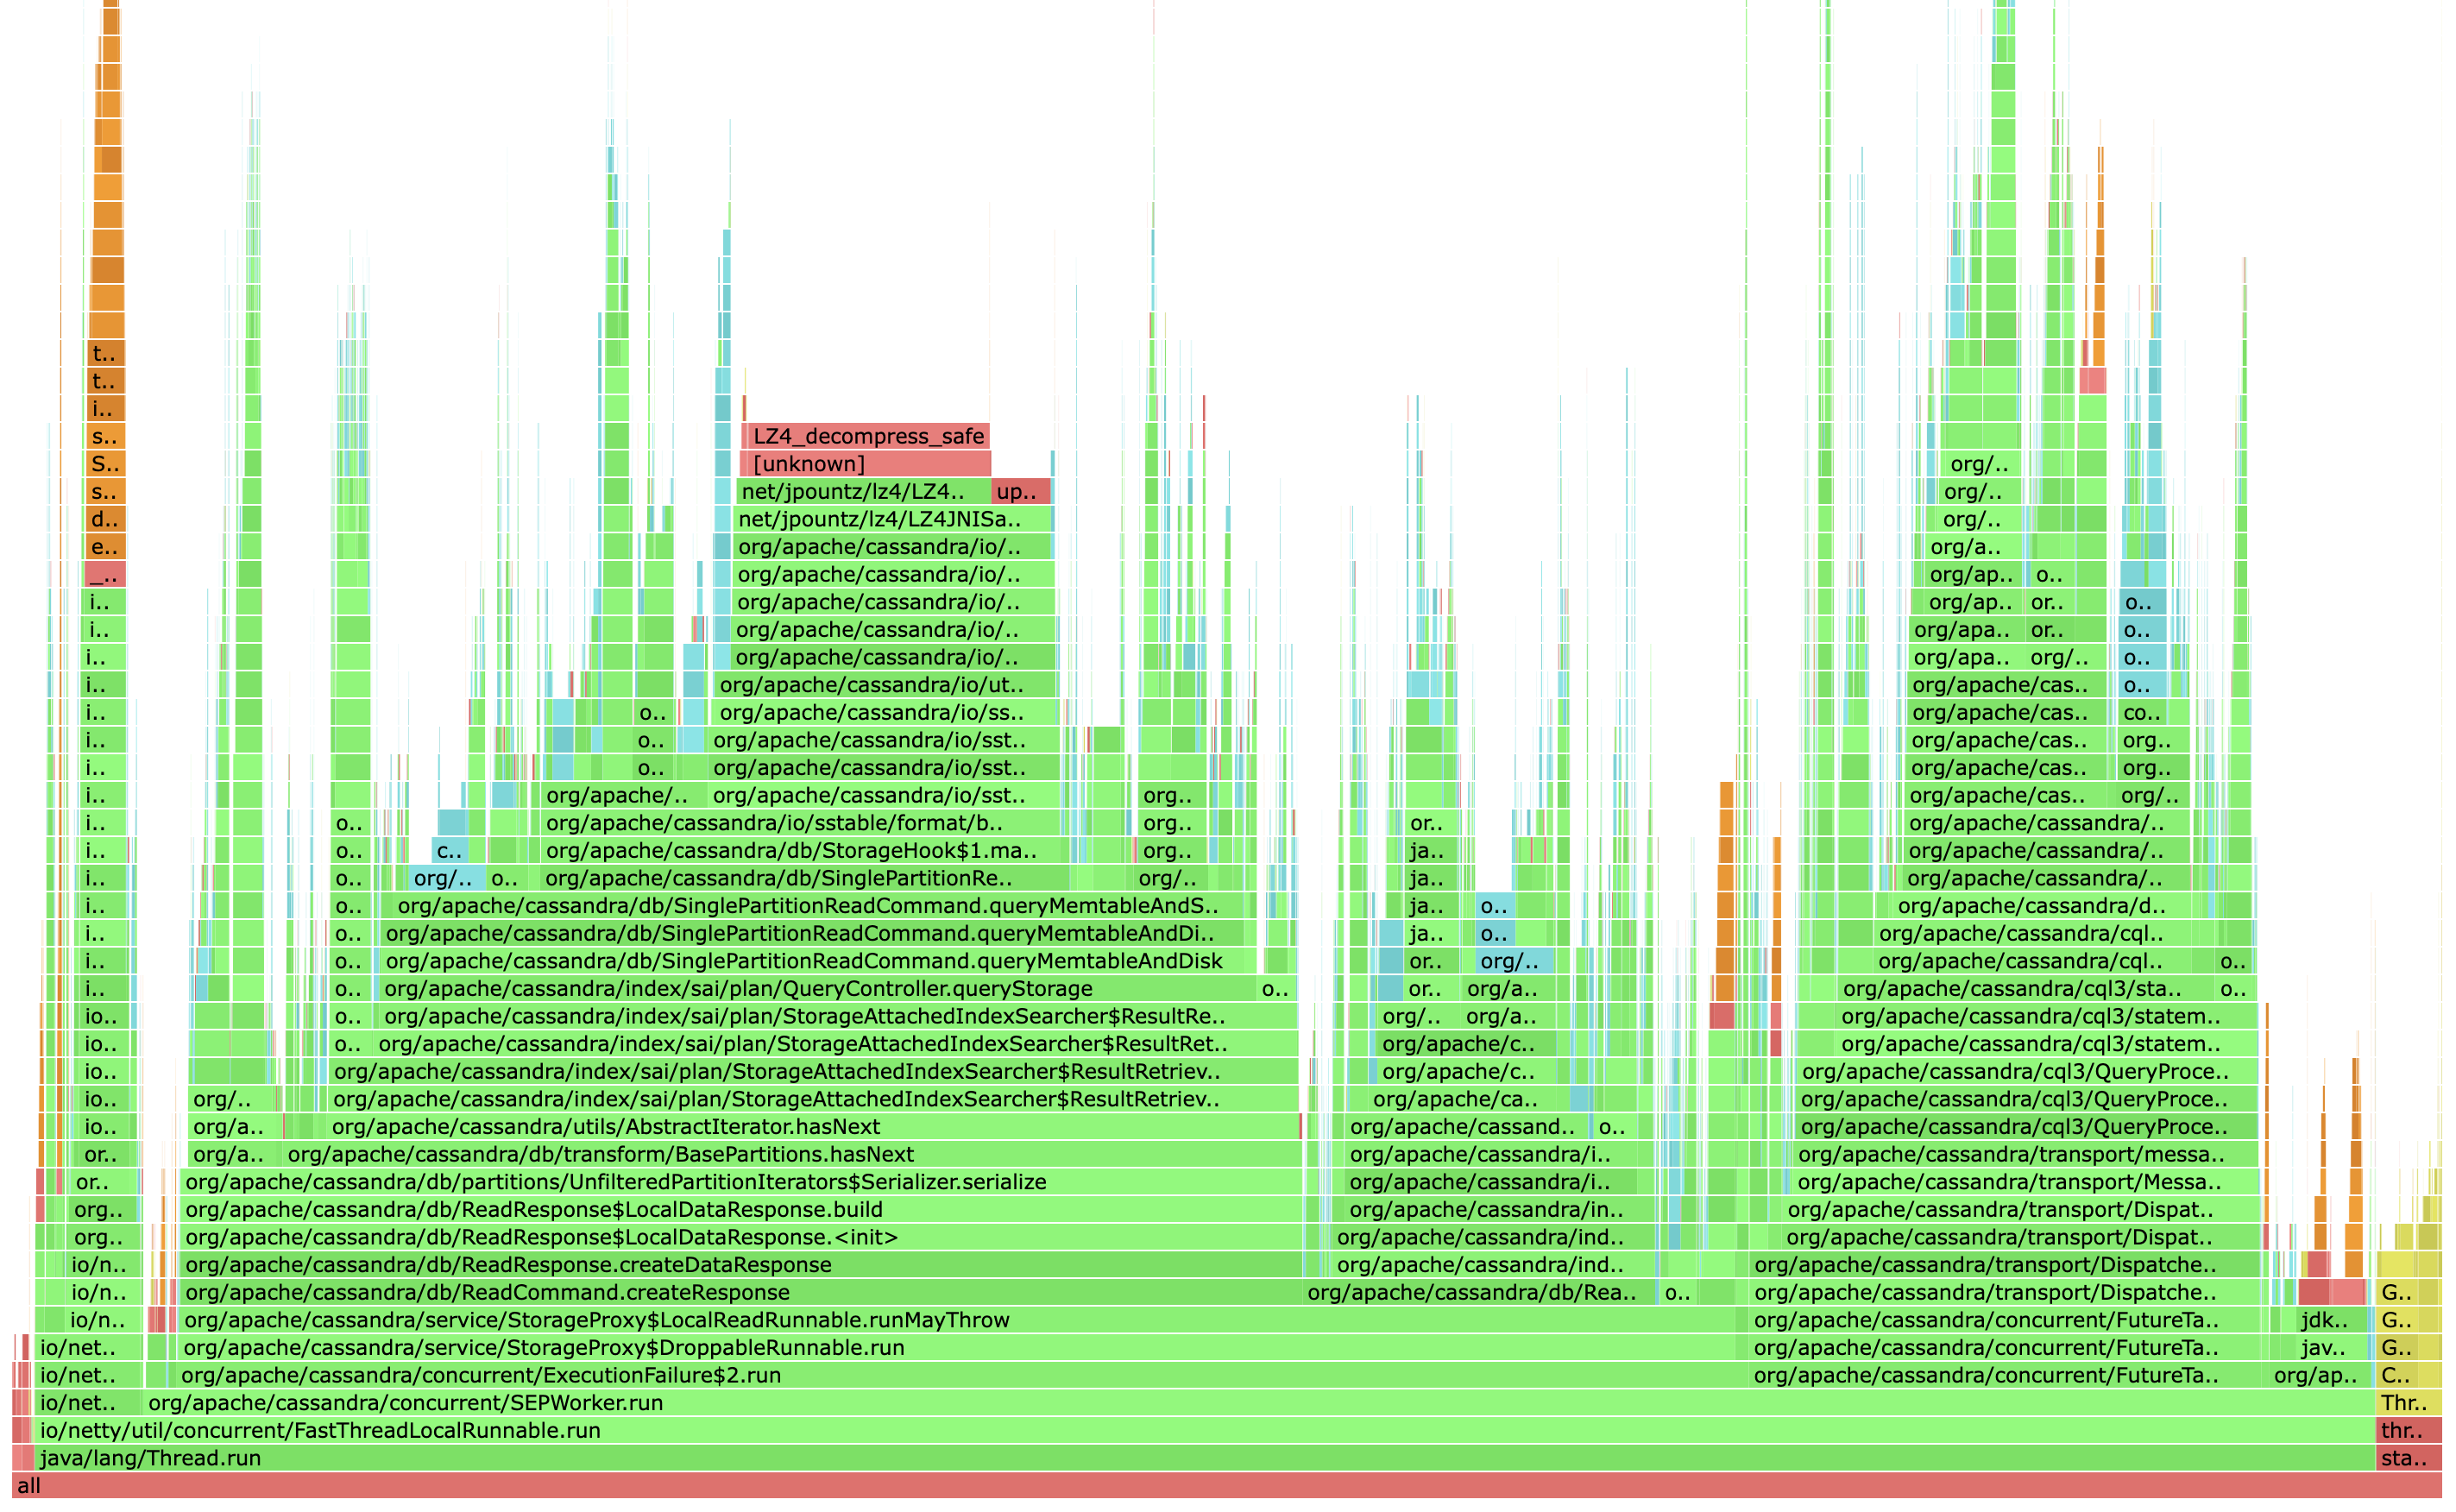
In this command, we profile CPU activity for 30 seconds against a 4.1 node and generate a flame graph in HTML format. In default mode, the graph is growing upwards, like a flame, representing each method in the stack. The width represents time spent. We can determine where our application is spending its time by visually inspecting the call stacks and their widths, looking for a pattern.
We can see above that LZ4_decompress_safe is taking up a significant amount of CPU. In the past I’ve written about the importance of tuning compression, especially for mixed and read heavy workloads. As our throughput increases, it becomes more and more critical to minimize our latency. In the case of tables with small partition sizes it’s often a very easy win to optimize our compression chunk length, reducing read amplification, at the tradeoff of using more memory for compression metadata. We’re going to take another look at this later in this series when we look at a real world tuning example.
Heap Profiling Apache Cassandra
Heap profiling helps you understand how Cassandra utilizes memory, discover potential memory leaks, and sometimes spot unwanted processes. Excessive allocations leads to longer and more frequent gc pauses, meaning minimizing allocations is going to help you maintain a more stable environment. This is generally applicable to any Java program, even with the newer Java versions offering low latency collectors!
Running heap profiles requires having the JDK debug symbols installed. On Ubuntu 22.04 with Java 11, you’ll need to run:
apt install openjdk-11-dbg
Other distributions have similar debug symbols available, use your package manager to find the appropriate one.
To profile Cassandra’s heap usage:
./profiler.sh -e alloc -d 30 -f /tmp/heap-cassandra-flamegraph.html $PID
This command captures heap allocation data for 30 seconds and generates an HTML Flamegraph.
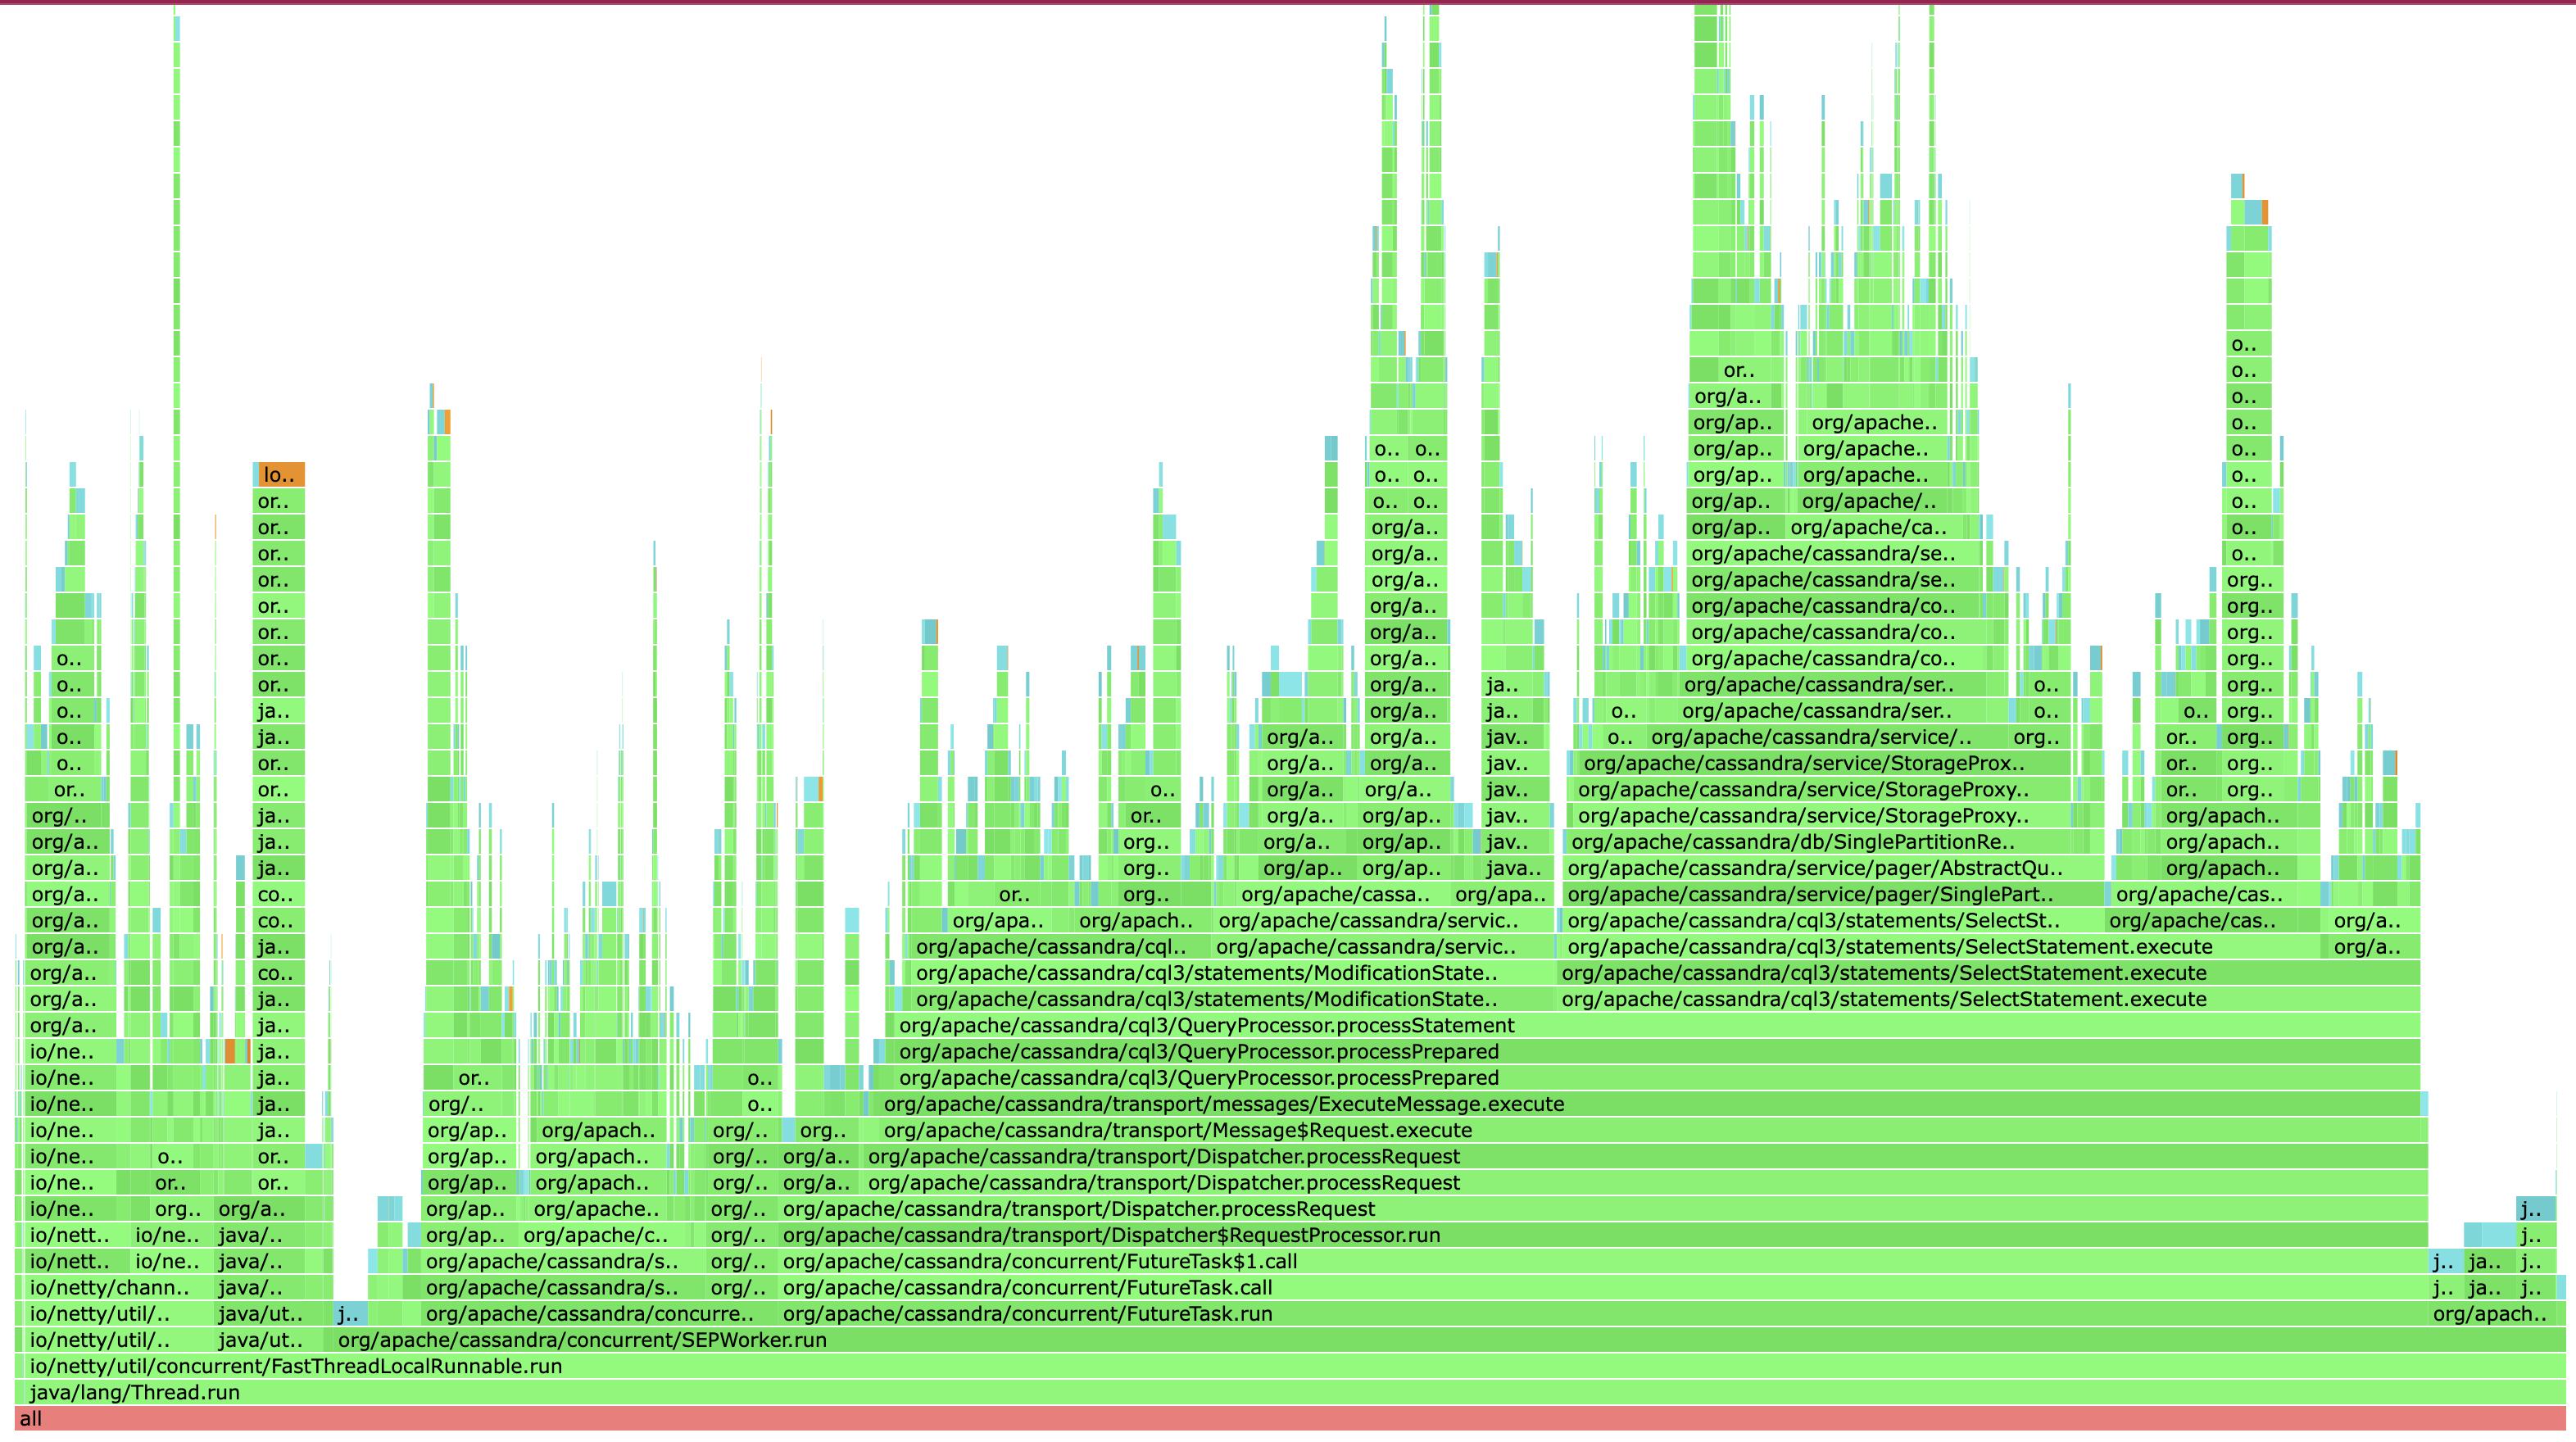
The above is taken from a healthy instance, operating on fairly small values - around 100 bytes. Things are looking reasonable; there’s no outliers pointing to a specific problem. Here’s a different profile from a second profile run, running a workload where I’m reading large values:
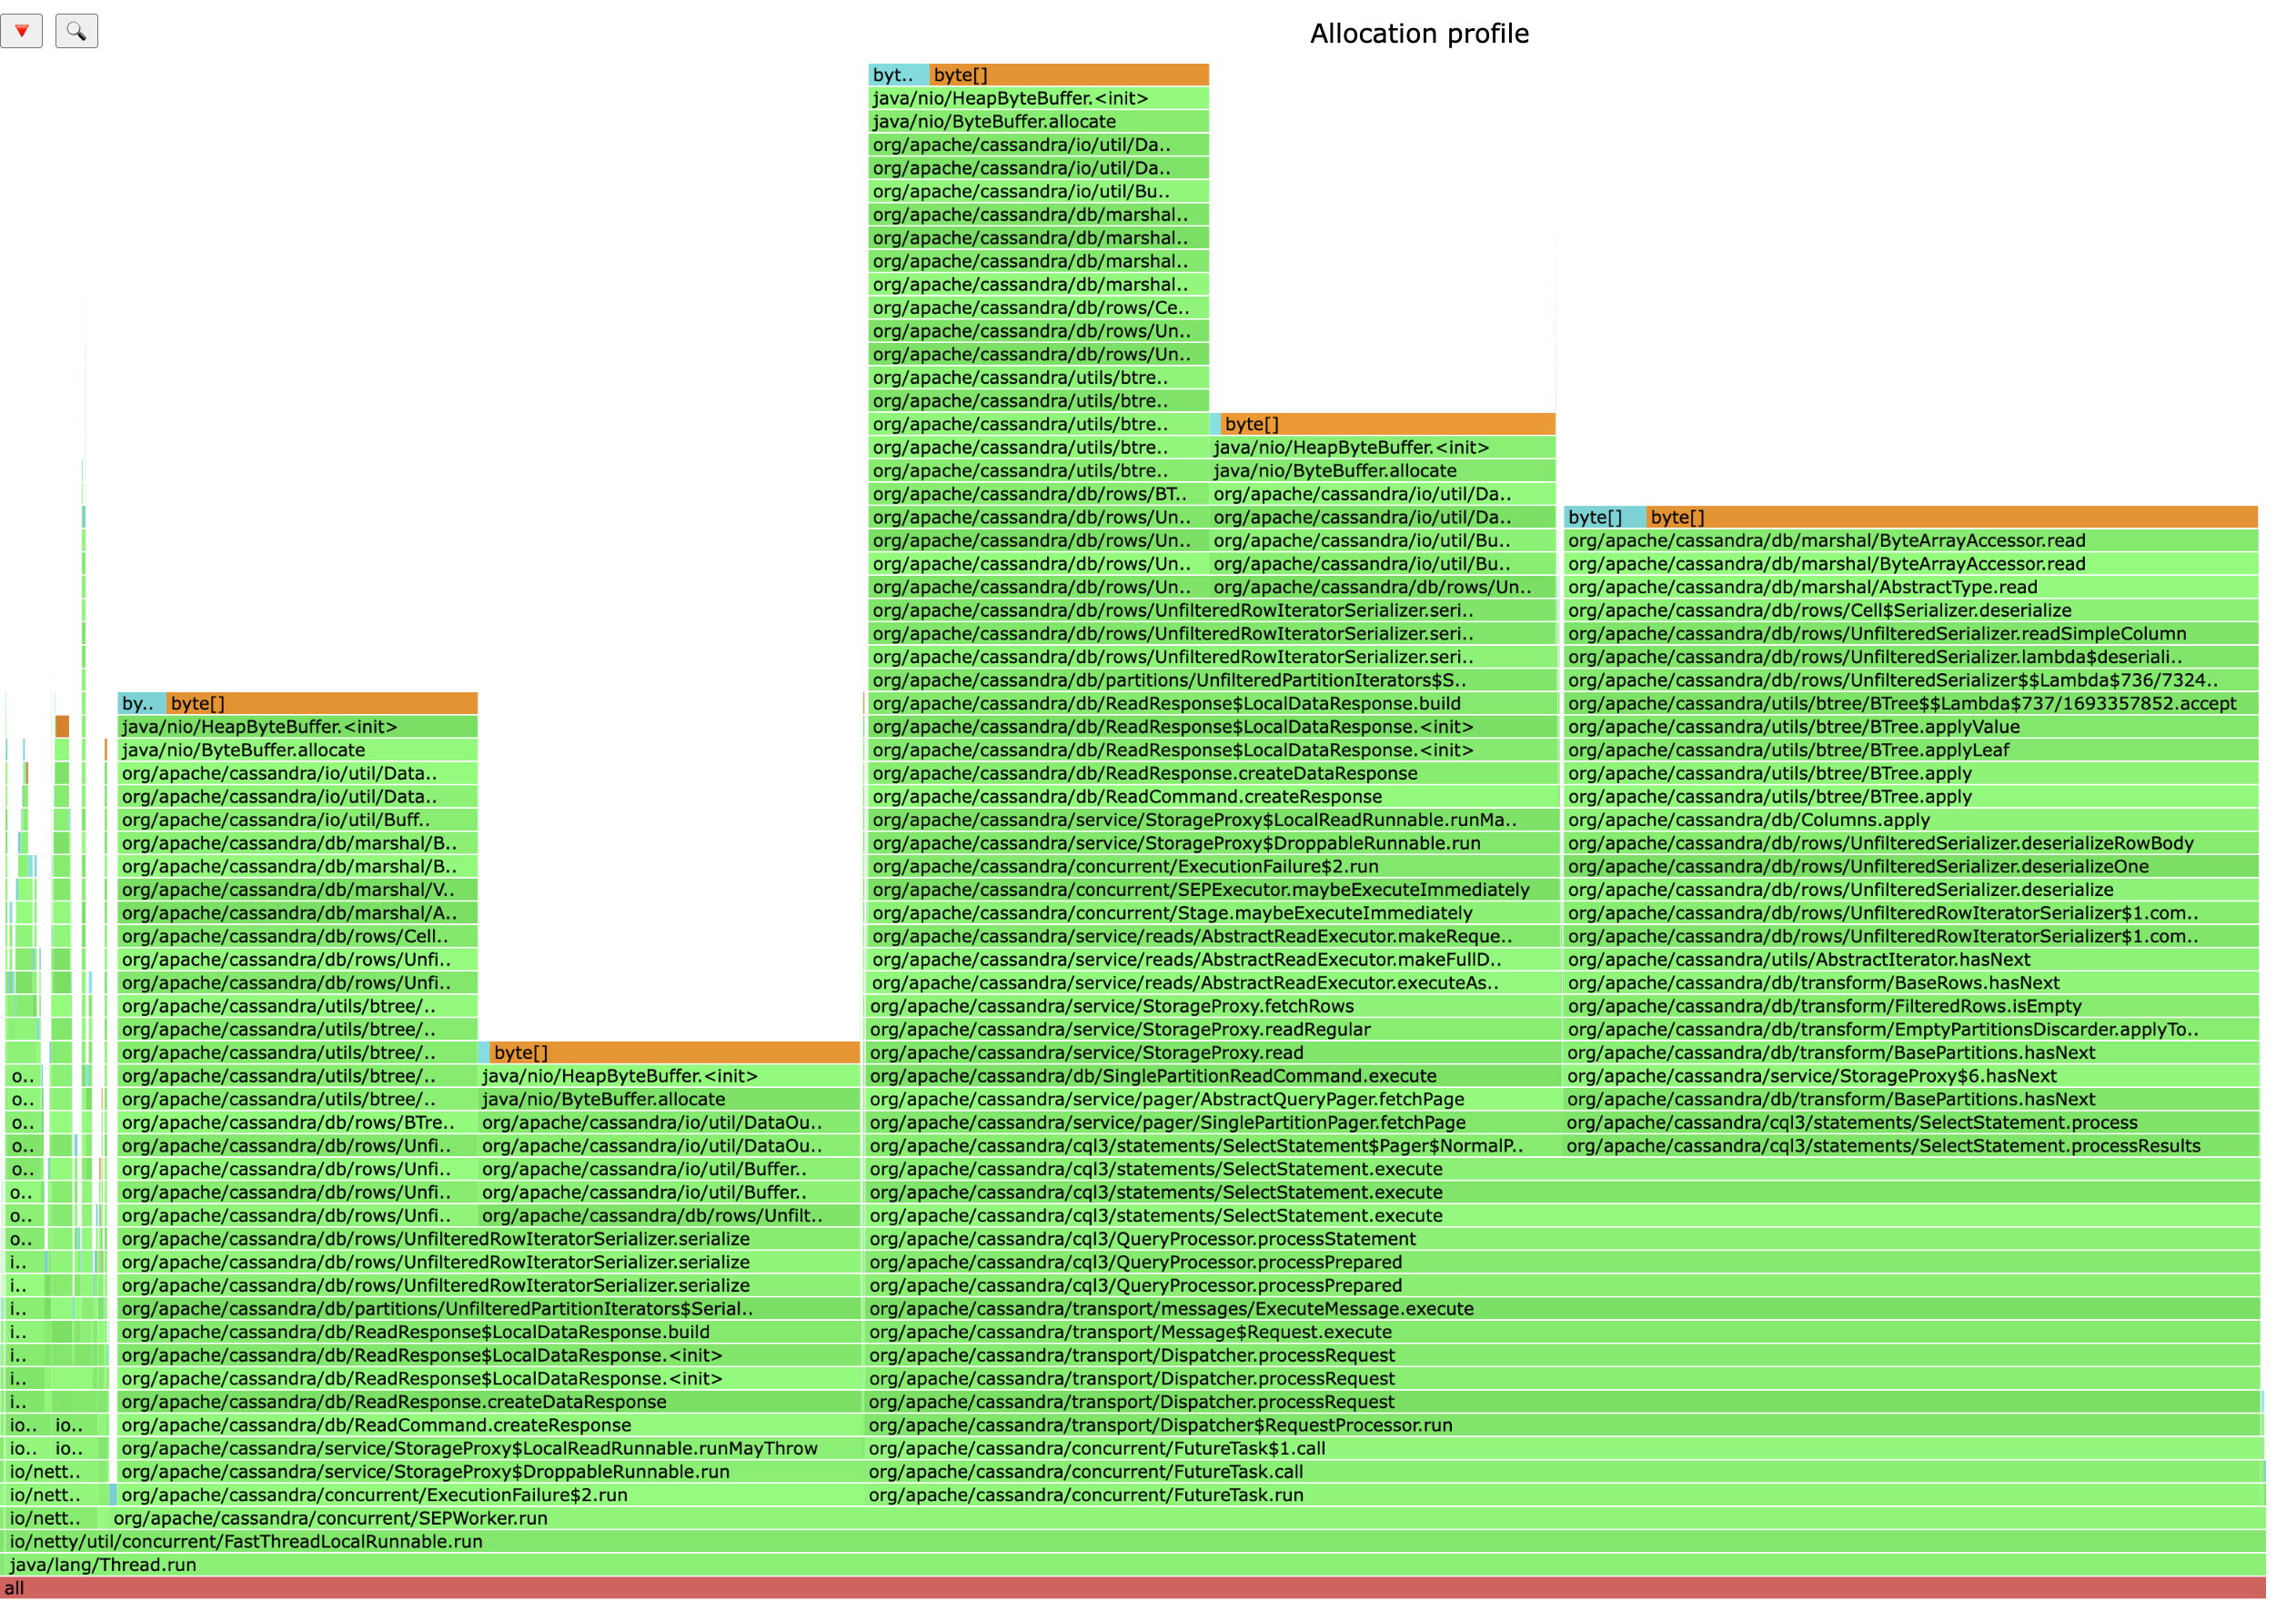
Woah! This looks way different. You can see the wide columns representing the call stack, with byte[] references at the top, and there’s several of them. Very interesting! We’re doing some fairly large allocations. You can also see in the call stack names containing ReadCommand, SelectStatement, and other names that suggest this is happening during reads. The heap profile here is an indication of two things:
- Large values are being returned to the user.
- On the Cassandra side, we could do a much better job using a buffer pools to avoid unnecessary allocations. This is a clear case for an optimization!
Conclusion
At this point you should be comfortable using the basic functionality of async-profiler, allowing you to uncover many performance bottlenecks and tune your cluster. By focusing on CPU and heap profiling, you can gain deep insights into how Cassandra utilizes system resources and identify areas that need attention. It also happens to be great way to get familiar with the codebase! Armed with this knowledge, you can optimize your Cassandra configuration and code, delivering better performance and scalability for your applications. If you enjoyed this post, be sure to check out the next in the series, Hardware profiling with bcc-tools.
Happy profiling!
If you found this post helpful, please consider sharing to your network. I'm also available to help you be successful with your distributed systems! Please reach out if you're interested in working with me, and I'll be happy to schedule a free one-hour consultation.